Leadership

Arrhenius equation and its graphical representation

Twelve Standard >> Arrhenius equation and its graphical representation

 
Leadership
Significance of Arrhenius equ


Arrhenius Equation and Its Graphical Representation


The Arrhenius equation is a fundamental formula in chemical kinetics that explains how the rate of a chemical reaction depends on temperature and activation energy. Named after the Swedish scientist Svante Arrhenius, it quantifies the relationship between the rate constant and temperature.

Arrhenius Graph

Mathematical Form of the Arrhenius Equation

The general form of the Arrhenius equation is:

k = A · e–Ea/RT

Where:

  • k = rate constant of the reaction
  • A = frequency factor (pre-exponential factor)
  • Ea = Represents the activation energy, measured in joules per mole (J/mol)
  • R = Universal gas constant, with a value of 8.314 J·mol–1·K–1
  • T = Absolute temperature expressed in Kelvin (K)

Understanding the Equation

The Arrhenius equation shows that as temperature increases, the exponential term becomes less negative, causing the rate constant k to increase. This means reactions occur faster at higher temperatures because more molecules have sufficient energy to overcome the activation energy barrier.

Graphical Representation of the Arrhenius Equation

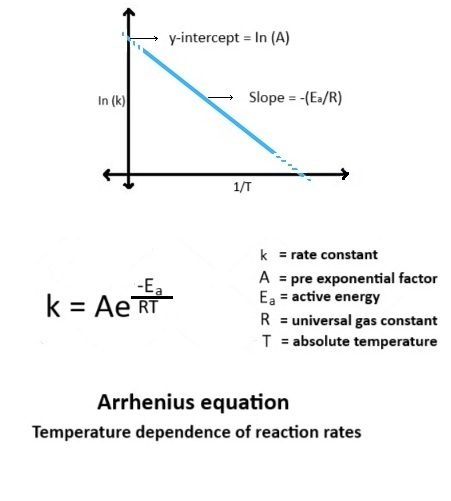
The Arrhenius equation can be transformed into a linear form by taking the natural logarithm of both sides:

ln k = ln A – Ea/R · (1/T)

This equation is of the form y = mx + c, where:

  • y = ln k
  • m = –Ea/R (slope)
  • x = 1/T
  • c = ln A (intercept)

Plotting ln k against 1/T yields a straight line with a negative slope, which can be used to calculate the activation energy.

Importance of the Graph

  • The linear graph illustrates that the rate constant changes exponentially with temperature.
  • From the slope (–Ea/R), activation energy can be calculated.
  • Intercept gives information about the frequency factor (ln A).

Real-Life Applications

  • Helps understand how food spoils faster at higher temperatures.
  • Used in pharmaceutical industry to predict shelf life of drugs.
  • Assists in designing temperature-sensitive industrial reactions.

Conclusion

The Arrhenius equation provides a clear link between temperature and reaction rate. Its graphical form is a valuable tool for calculating activation energy and understanding the temperature dependence of chemical reactions.

ation with graphical representation.
Leadership
Hand drawn

Hide

Forgot your password?

Close

Error message here!

Hide

Lost your password? Please enter your email address. You will receive a link to create a new password.

Back to log-in

Close